
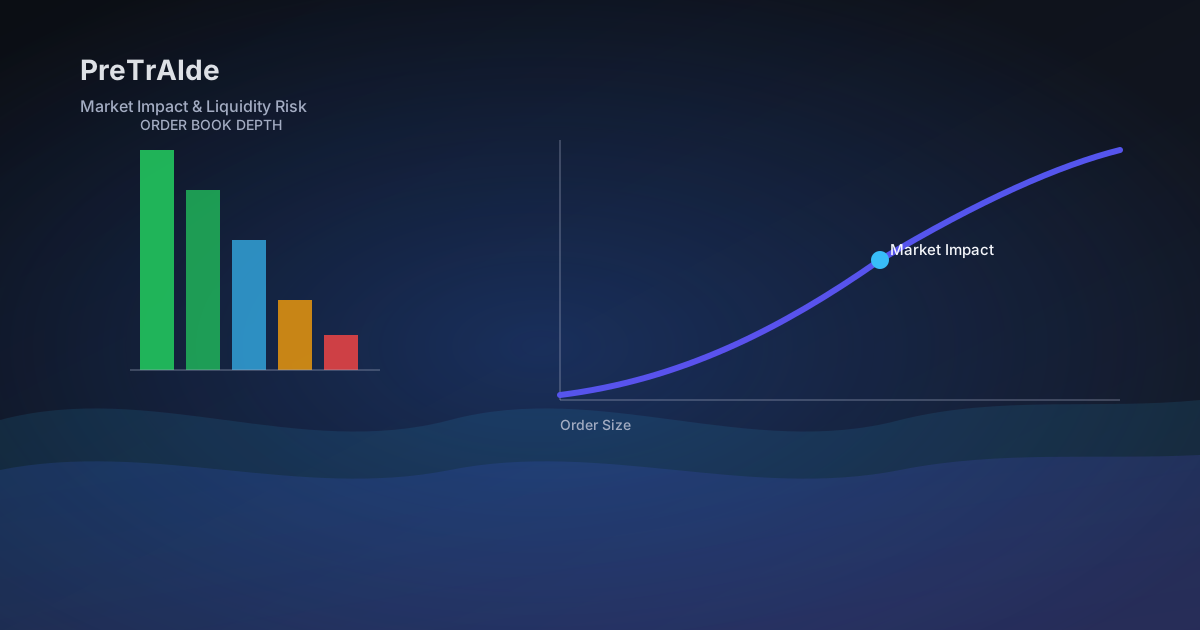
Two investors buy the same stock, same day, same conviction. One pays 0.2% more than the quoted price to get filled and barely notices. The other pays 3% more, wipes out a quarter of their expected edge, and never understands why. The difference usually isn't luck — it's liquidity, and it's measurable before you ever place the order.
Liquidity Isn't "Can I Buy It." It's "What Will It Cost Me to Buy It."
Retail platforms show you a bid, an ask, and a "Buy" button. What they don't show you is how the price would move if you were the marginal buyer for the size you actually want — which is precisely the question institutional pre-trade desks exist to answer. PreTrAIde brings two of their core metrics to a retail basket: liquidity ratios and market impact.
Daily and Period Liquidity Ratios (DLR / PLR)
These metrics estimate how large your position is relative to the stock's typical trading volume — on a single day (DLR) and across the period you intend to hold or trade the position (PLR). A position that's 0.1% of average daily volume behaves very differently from one that's 8% of it, even if it's the "same trade" in dollar terms on two different stocks.
Market Impact Modeling
PreTrAIde's market impact estimate is built on the same family of models institutional desks use — most notably the Almgren-Chriss framework, which separates the cost of trading into a temporary component (the price concession needed to get filled right now) and a permanent component (the lasting price shift your order leaves behind). For a retail basket, this translates into a concrete estimate: roughly how much execution cost you should expect to give up to market impact alone, before the market's normal day-to-day movement even enters the picture.
Where the Underlying Data Gets Estimated
Not every input a serious liquidity model needs is published by market data vendors — spread, order-book depth by venue, and the split between visible and hidden volume are rarely available at the retail data tier. Where that's the case, PreTrAIde uses established market-microstructure theory to estimate them: blended volatility estimators (Parkinson, Close-to-Close, Yang-Zhang, and a simplified GARCH(1,1) model) and spread/venue heuristics grounded in classic market-microstructure research on how informed and uninformed order flow behaves. This is disclosed deliberately: an estimate grounded in established theory, clearly labeled as such, is far more useful than a metric that pretends to be exact when the underlying data simply doesn't exist at retail granularity.
Reading a Liquidity Risk Flag
When PreTrAIde's pre-trade analysis flags liquidity or market impact risk on a basket, it's typically telling you one of a few things:
What a liquidity flag usually means
Your intended position size is large relative to the stock's typical volume, so entering or exiting could move the price meaningfully against you. Or: the stock's recent volatility regime has widened, which raises the estimated cost of getting filled at a favorable price. Either way, the suggested execution strategy that accompanies a GO or MODIFY verdict is designed to address exactly this — often through position sizing or a phased entry rather than a single order.
Why This Matters More As Baskets Get Bigger
Liquidity risk scales in a way that catches a lot of investors off guard: doubling a position size doesn't just double your market exposure, it can more than double your expected market impact cost, because you're consuming a larger, less liquid slice of the order book. This is exactly the kind of nonlinear risk that's invisible from a price chart and a "shares available" counter, but shows up clearly in a proper pre-trade liquidity analysis.
Check Your Own Basket's Liquidity Profile
Run a pre-trade analysis on any basket to see its liquidity ratios, estimated market impact, and a plain-language risk assessment — the same category of metrics a program-trading desk would review before executing a large order, applied to your own portfolio.